Table of Contents
- Why Sample Size Matters
- The Four Inputs
- Worked Examples
- What Changes When You Raise Confidence or Power
- How Long Will the Test Take?
- The Biggest Mistake: Stopping Early
- Other Common Mistakes
- When You Do Not Have Enough Traffic
- Example Plan
- Frequently Asked Questions
- What is a good sample size for an A/B test?
- How many conversions do I need?
- What is statistical significance in A/B testing?
- What is minimum detectable effect?
- Can I stop a test early if one version is winning?
- How long should an A/B test run?
- Final Thoughts
An A/B test needs a fixed number of visitors per version before its result means anything, and that number is usually larger than people expect. With a 3% conversion rate and a goal of detecting a 20% relative lift (3.0% to 3.6%), you need about 13,900 visitors per version, so roughly 27,800 in total. Decide this number before you start, then wait until you reach it.
You can calculate your own number with the free A/B test sample size calculator.
Why Sample Size Matters
Conversions are random. If you send 1,000 visitors to a page with a true 3% rate, you will not get exactly 30 conversions every time. One week you might get 24, the next 36. If you run two identical pages, one will often look "better" just by chance.
A sample size calculation tells you how many visitors you need so that a real difference stands out from this noise. Too few visitors and you either miss real improvements or, worse, act on differences that were only luck.
The Four Inputs
- Baseline conversion rate. Your current rate for the page or step you are testing. Use your own conversion rate, measured with the same definitions you will use in the test.
- Minimum detectable effect. The smallest improvement worth detecting, usually stated as a relative lift. A 20% lift on a 3% rate means 3.0% to 3.6%.
- Confidence (significance) level. Usually 95%. It sets how often a test of two identical pages would wrongly declare a winner: about 5% of the time at 95%.
- Power. Usually 80%. It is the chance that your test detects a real lift of the size you chose. At 80%, you will miss such a lift about one time in five.
Worked Examples
These numbers use the standard two-proportion formula at 95% confidence and 80% power, the same one the calculator uses.
| Baseline rate | Lift to detect | Variant rate | Visitors per version |
|---|---|---|---|
| 1% | 20% | 1.2% | about 42,700 |
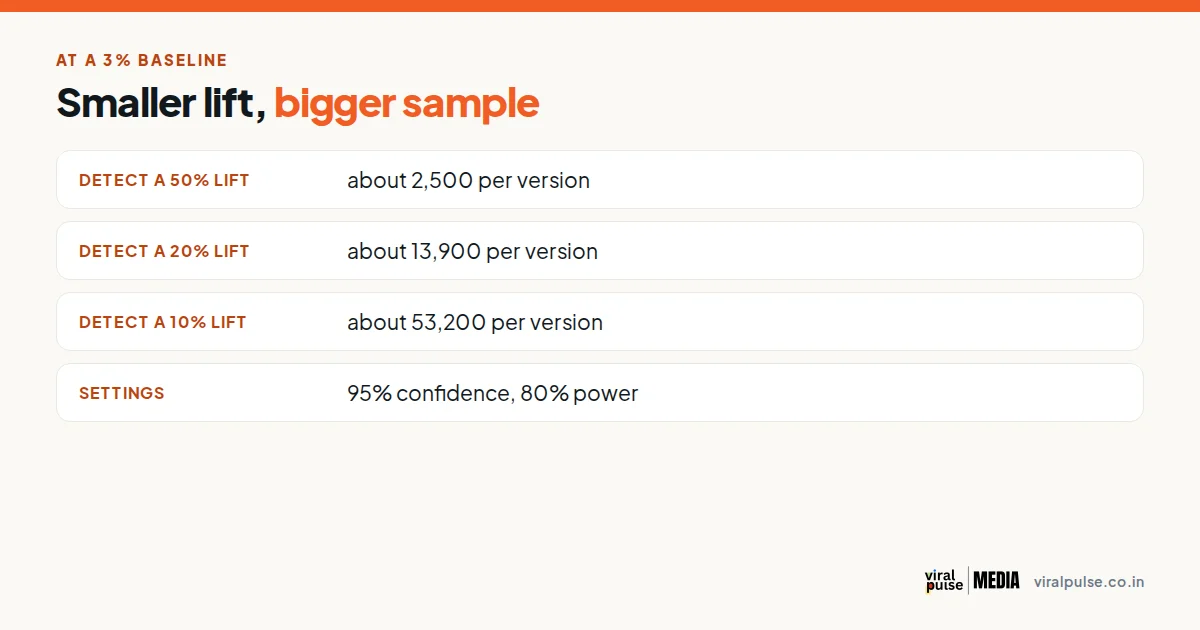
| 3% | 10% | 3.3% | about 53,200 |
| 3% | 20% | 3.6% | about 13,900 |
| 3% | 50% | 4.5% | about 2,500 |
| 5% | 20% | 6.0% | about 8,200 |
| 10% | 20% | 12.0% | about 3,800 |
Two patterns stand out:
- Smaller lifts need far more traffic. Halving the lift you want to detect, from 20% to 10%, roughly quadruples the sample.
- Low conversion rates need more traffic. A 1% page needs about three times as many visitors as a 3% page to detect the same relative lift.
What Changes When You Raise Confidence or Power
For a 3% baseline and a 20% lift:
- 90% confidence, 80% power: about 11,000 per version.
- 95% confidence, 80% power: about 13,900 per version.
- 99% confidence, 80% power: about 20,700 per version.
- 95% confidence, 90% power: about 18,600 per version.
Higher confidence means fewer false winners but a longer test. For most marketing tests, 95% and 80% is a sensible default.
How Long Will the Test Take?
Divide the total visitors needed by your daily traffic to that page. If you need 27,800 visitors and the page gets 700 a day, the test needs about 40 days. Run full weeks so weekday and weekend behaviour is balanced, and avoid starting during a sale or a holiday unless the test is about that period.
If the answer is several months, the test is not practical. You have three choices: test a bigger change, test on a page with more traffic, or measure a step earlier in the funnel that has a higher conversion rate.
The Biggest Mistake: Stopping Early
Checking the results every day and stopping the moment one version looks ahead inflates false positives. Early results swing widely, and a version that leads on day three often falls back by day twenty. This is called peeking.
How to avoid it:
- Write down the sample size and the end date before launch.
- Do not decide on partial data. Look at the dashboard if you must, but do not act on it.
- If you need to stop early for business reasons, treat the result as a hint, not a finding.
Some testing tools use sequential methods that allow safe early stopping. If yours does, follow its rules. If you are not sure, wait for the planned sample.
Other Common Mistakes
- Testing many things at once. Changing the headline, image and button together tells you the bundle won, not which change mattered. Test one idea at a time unless you have the traffic for multivariate tests.
- Running several variants without adjusting. Each extra variant raises the chance of a false winner and the sample you need.
- Ignoring segments by accident. If the test ran during a campaign that brought unusual traffic, the result may not hold afterwards.
- Measuring the wrong thing. A higher click rate on a button is not a win if sales fall. Pick the final result you care about as the main metric.
- Declaring "no difference" too fast. A test that did not reach significance did not prove the pages are equal. It may have been too small to tell.
When You Do Not Have Enough Traffic
Small sites cannot test small changes. Better options are:
- Make bigger, bolder changes, such as a new offer or a rewritten page, and test those.
- Use before-and-after comparisons carefully, knowing they cannot rule out seasonality.
- Rely on qualitative evidence: call recordings, customer questions, session recordings and surveys, then fix what repeatedly confuses people.
- Improve basics first: clearer promise, faster mobile page, shorter form, real proof.
Tests need traffic. Common-sense fixes do not.
Example Plan
A coaching institute's enquiry page converts 4% of 600 daily visitors. They want to test a shorter form and care about a lift of at least 25% (4% to 5%).
- The calculator gives roughly 6,700 visitors per version, about 13,400 in total.
- At 600 visitors a day, that is about 22 days, so they plan for 4 full weeks.
- They write down the end date, the main metric (submitted enquiries) and the rule: no decision before the end.
Frequently Asked Questions
What is a good sample size for an A/B test?
It depends on your baseline rate and the lift you want to detect. For a 3% baseline and a 20% relative lift, about 13,900 visitors per version at 95% confidence and 80% power.
How many conversions do I need?
A rough rule is that you want hundreds of conversions per version, but the visitor count from the calculator is a better guide because it accounts for your baseline and target lift.
What is statistical significance in A/B testing?
It is a measure of how unlikely the observed difference would be if both versions were really identical. At 95%, you accept about a 5% chance of a false winner.
What is minimum detectable effect?
The smallest improvement you care about finding. Smaller values need much bigger samples.
Can I stop a test early if one version is winning?
Not safely, unless your tool uses a method designed for it. Early leads often disappear.
How long should an A/B test run?
Until you reach the planned sample, and for at least one or two full weeks so weekday patterns are included.
Not Sure What to Test First?
We review your funnel, find the biggest drop-off and help plan tests that your traffic can actually support.
Final Thoughts
Plan the sample size before the test, change one idea at a time and resist peeking. When you are ready, put your own numbers into the free A/B test sample size calculator.
Want this executed for you?
Our agency team builds and runs social engines for B2B and SaaS brands.
Written by Mehran Shahmiri
Founder of Viral Pulse Media. Started as a freelance social media marketer in 2021, and is based in Srinagar, Kashmir. Also founder of OpenLoop Systems.
Follow on LinkedIn →